
BEFORE YOU START
What you need
- Your role allows dashboard access, the correct CUCM connection is selected and relevant data collection is configured.
- Visible widgets depend on licensing, permissions and enabled features such as topology or automatic provisioning.
Select the operational scope
Where to work: Cisco → Dashboard
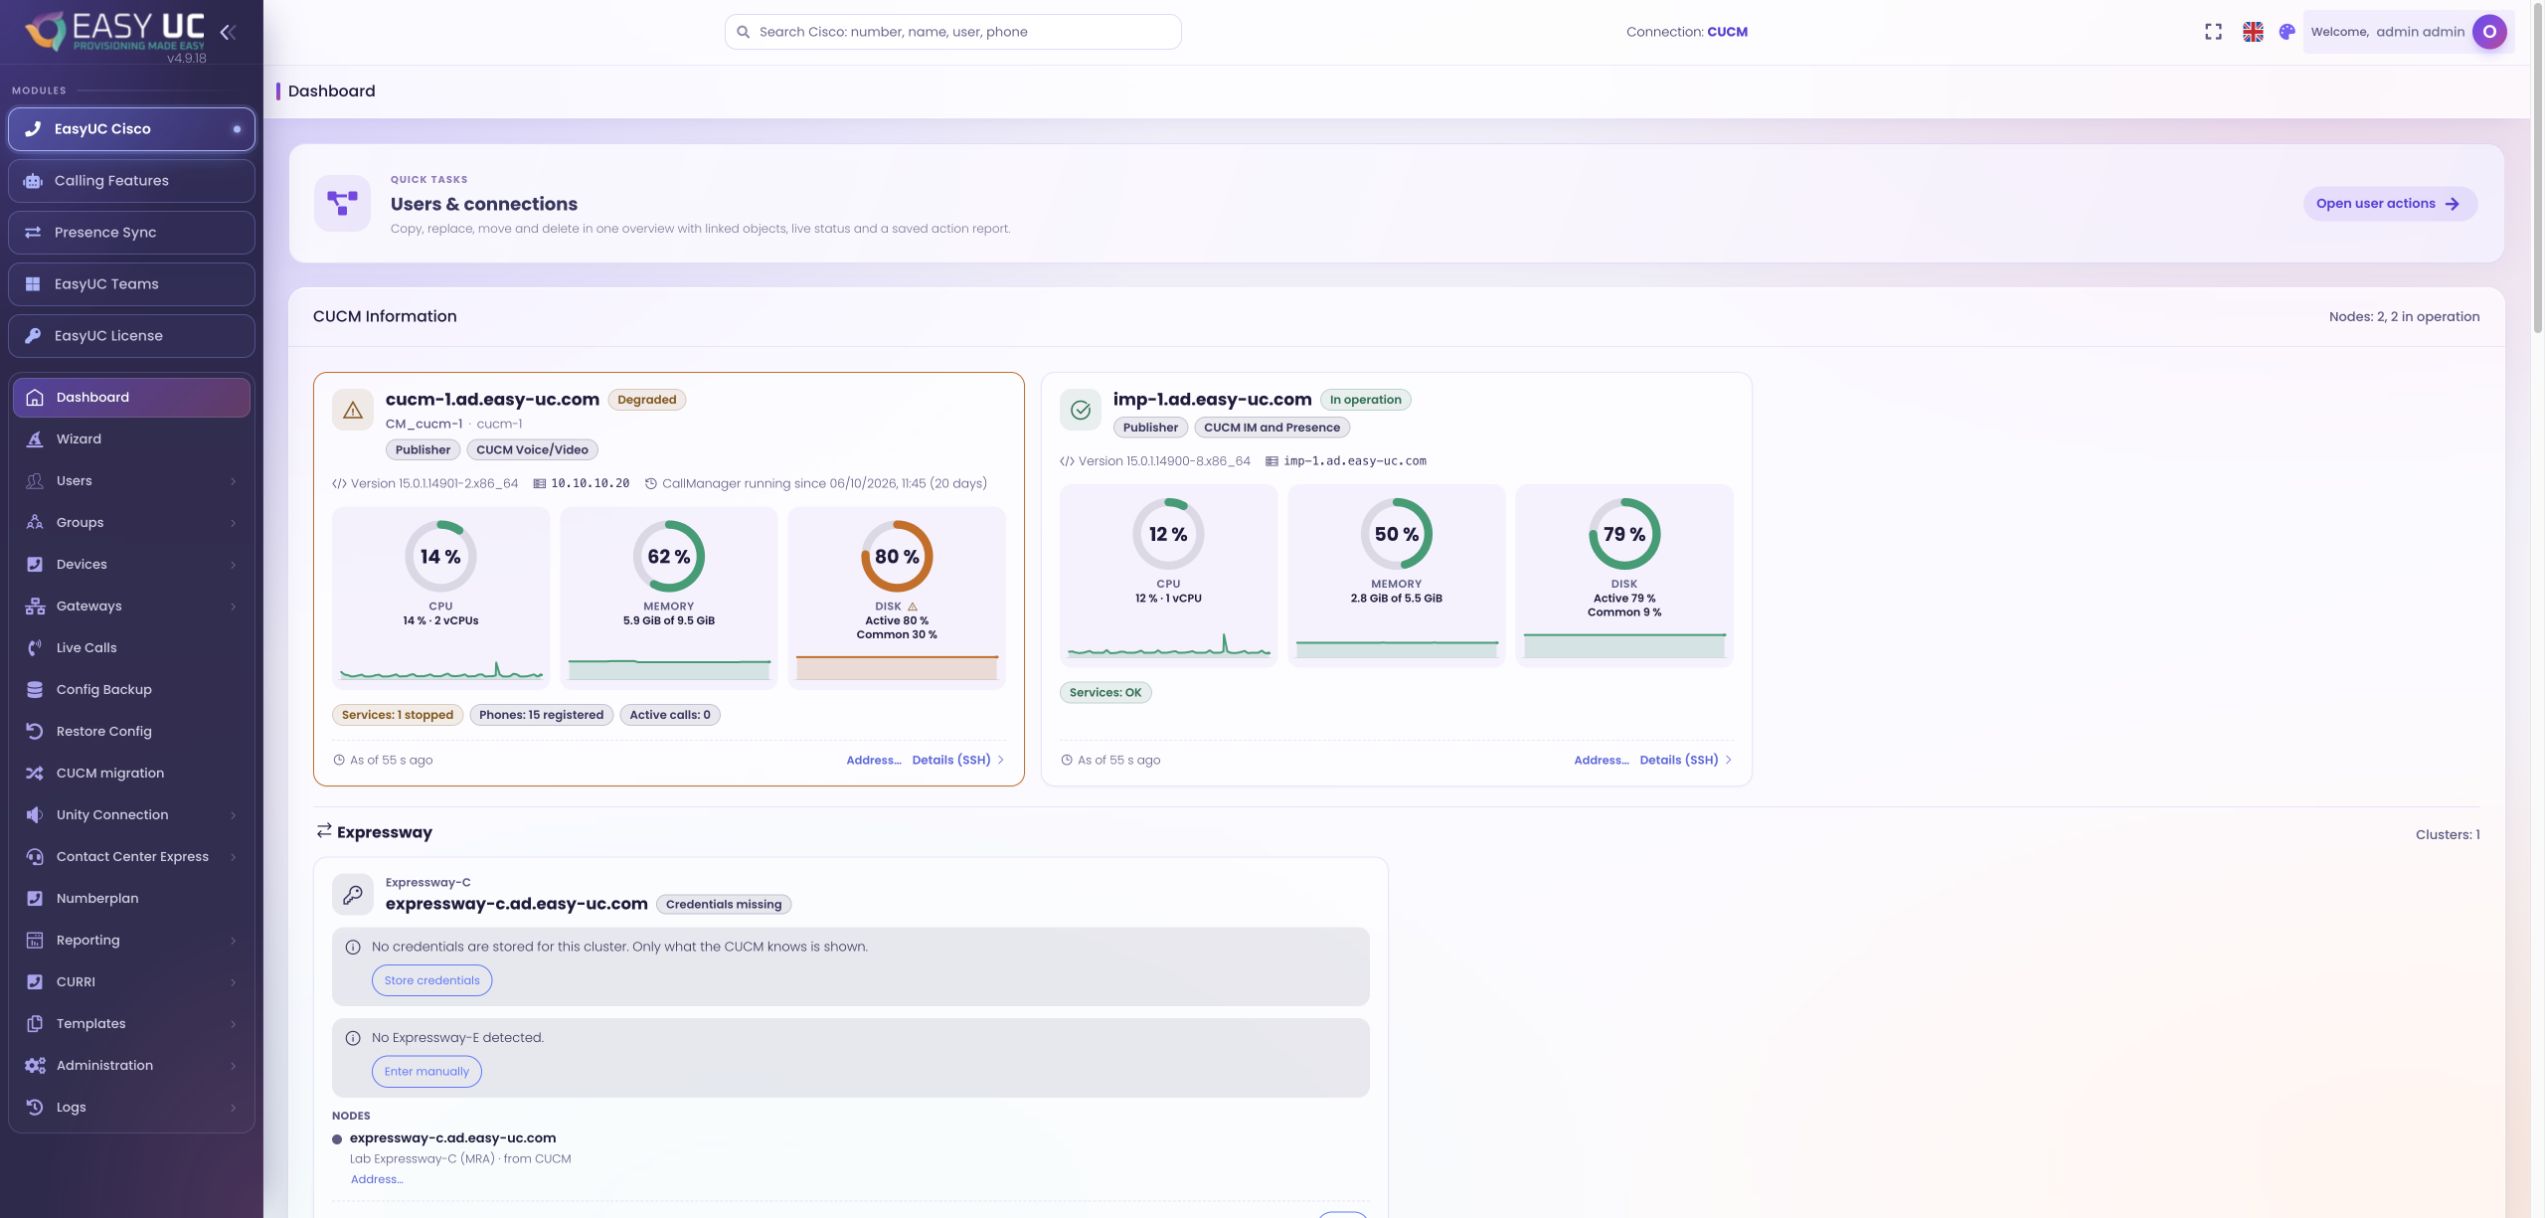
Open the dashboard and verify the active CUCM connection. In multi-cluster environments, metrics should not be mistaken for a global view. Note visible widgets: absence can reflect permissions or disabled features rather than missing infrastructure.
Inspect nodes and operational indicators
Where to work: Dashboard → Process nodes
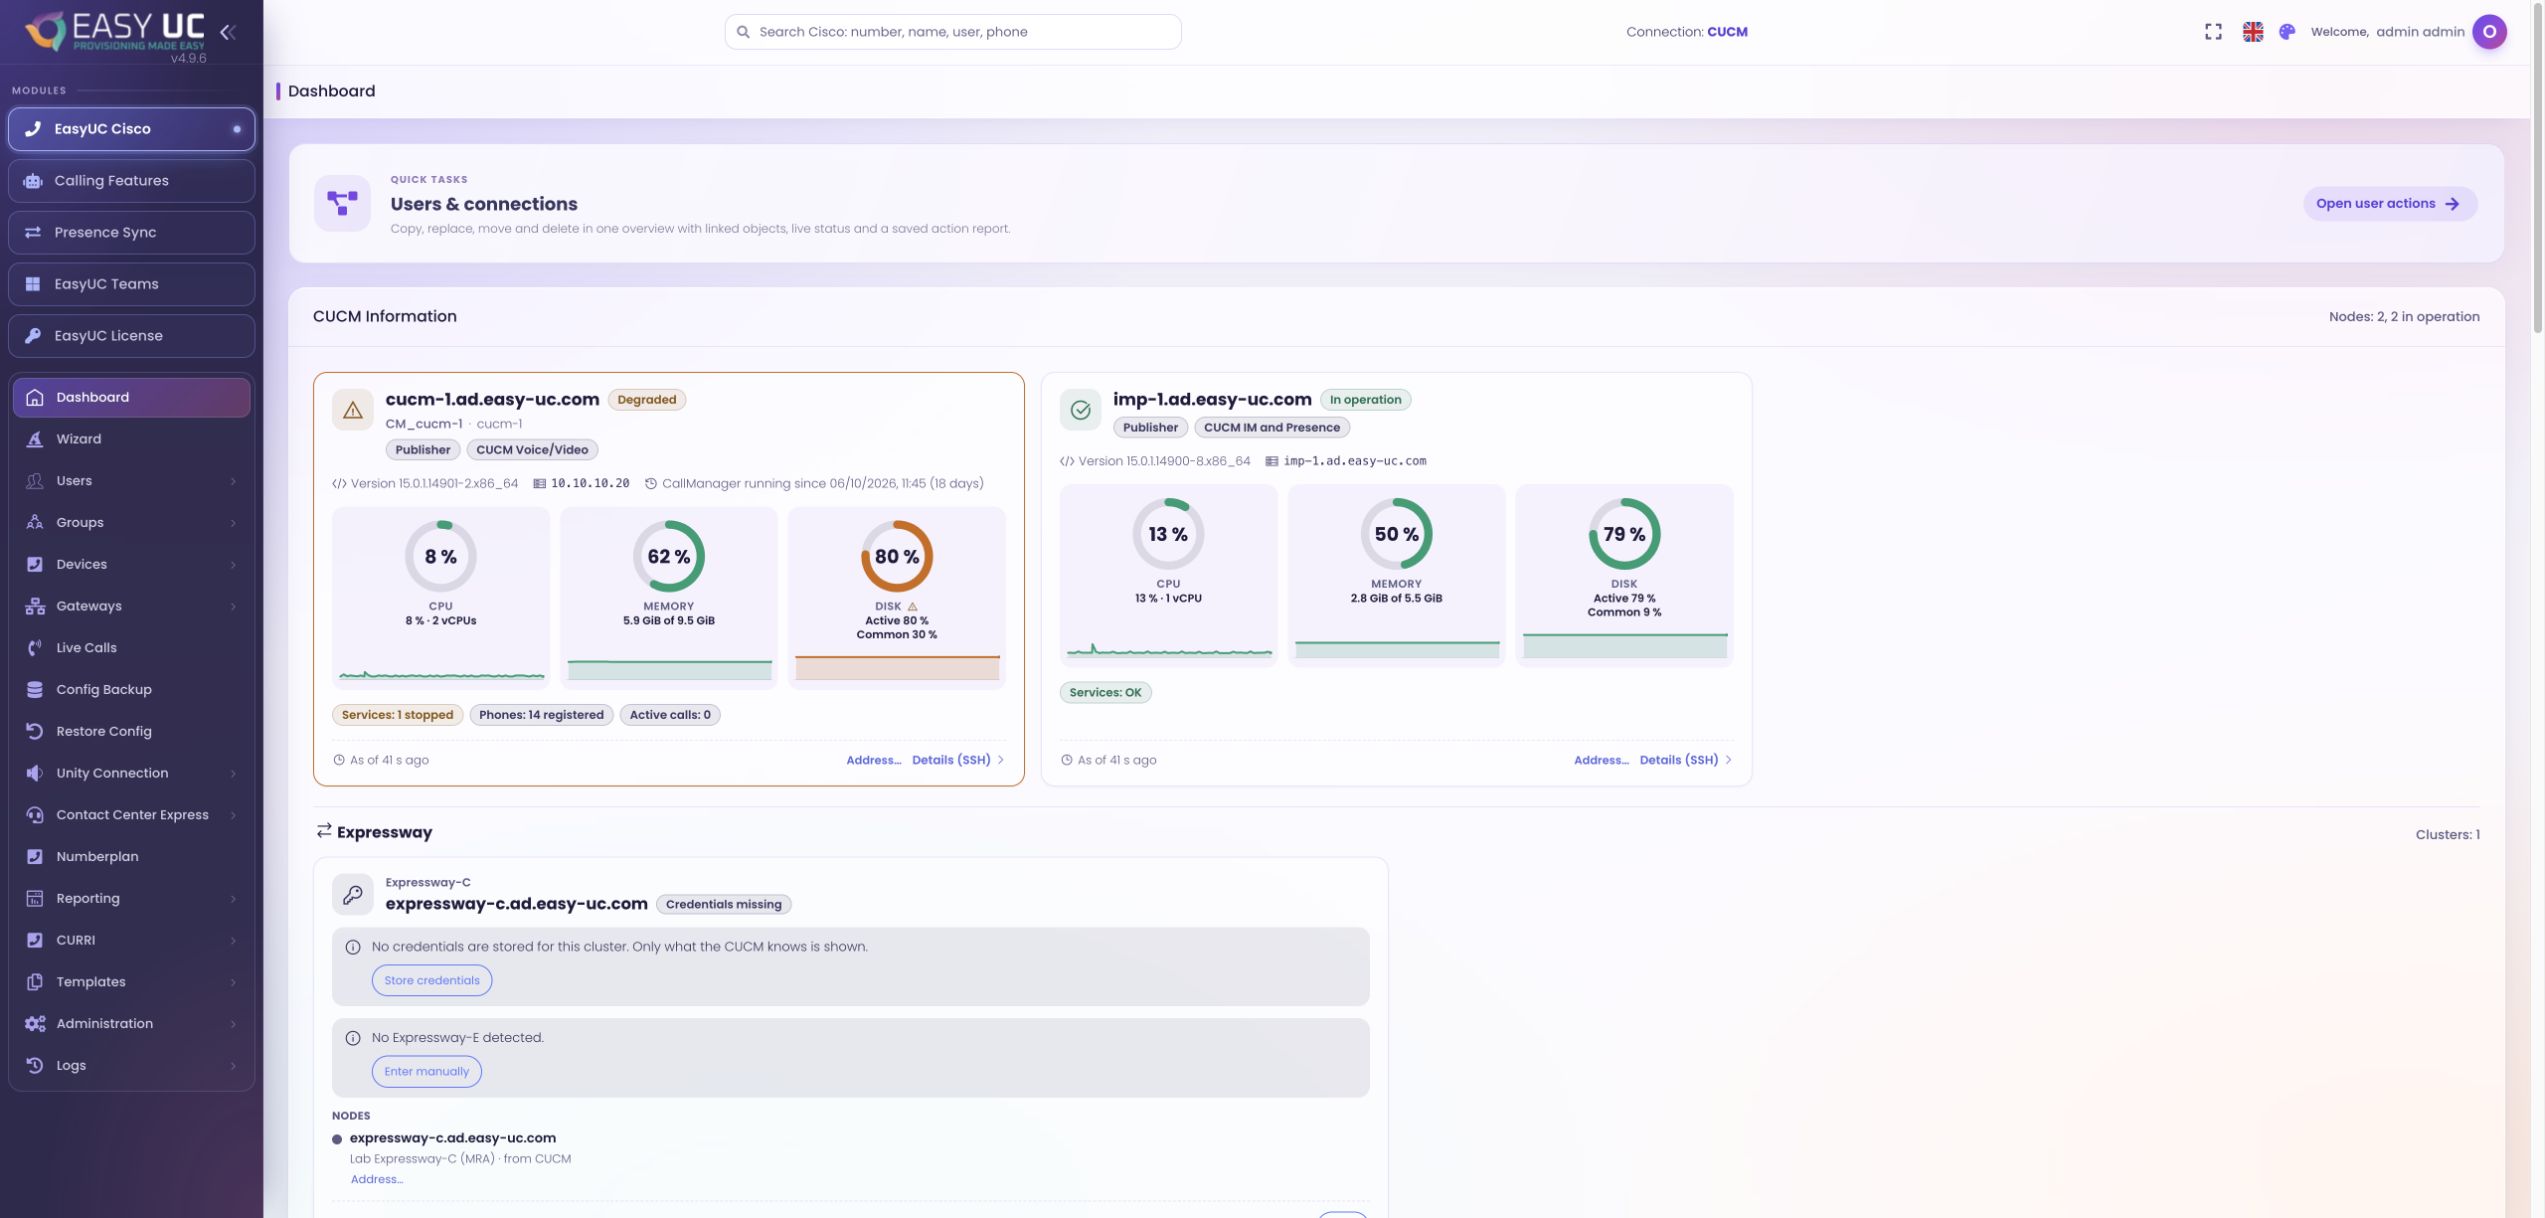
Compare displayed nodes and operational information with the expected environment, then investigate anomalies in the relevant detail view. Treat dashboard indicators as a starting point rather than a complete service or user-experience test.
Review device registrations in context
Where to work: Dashboard → Device registrations
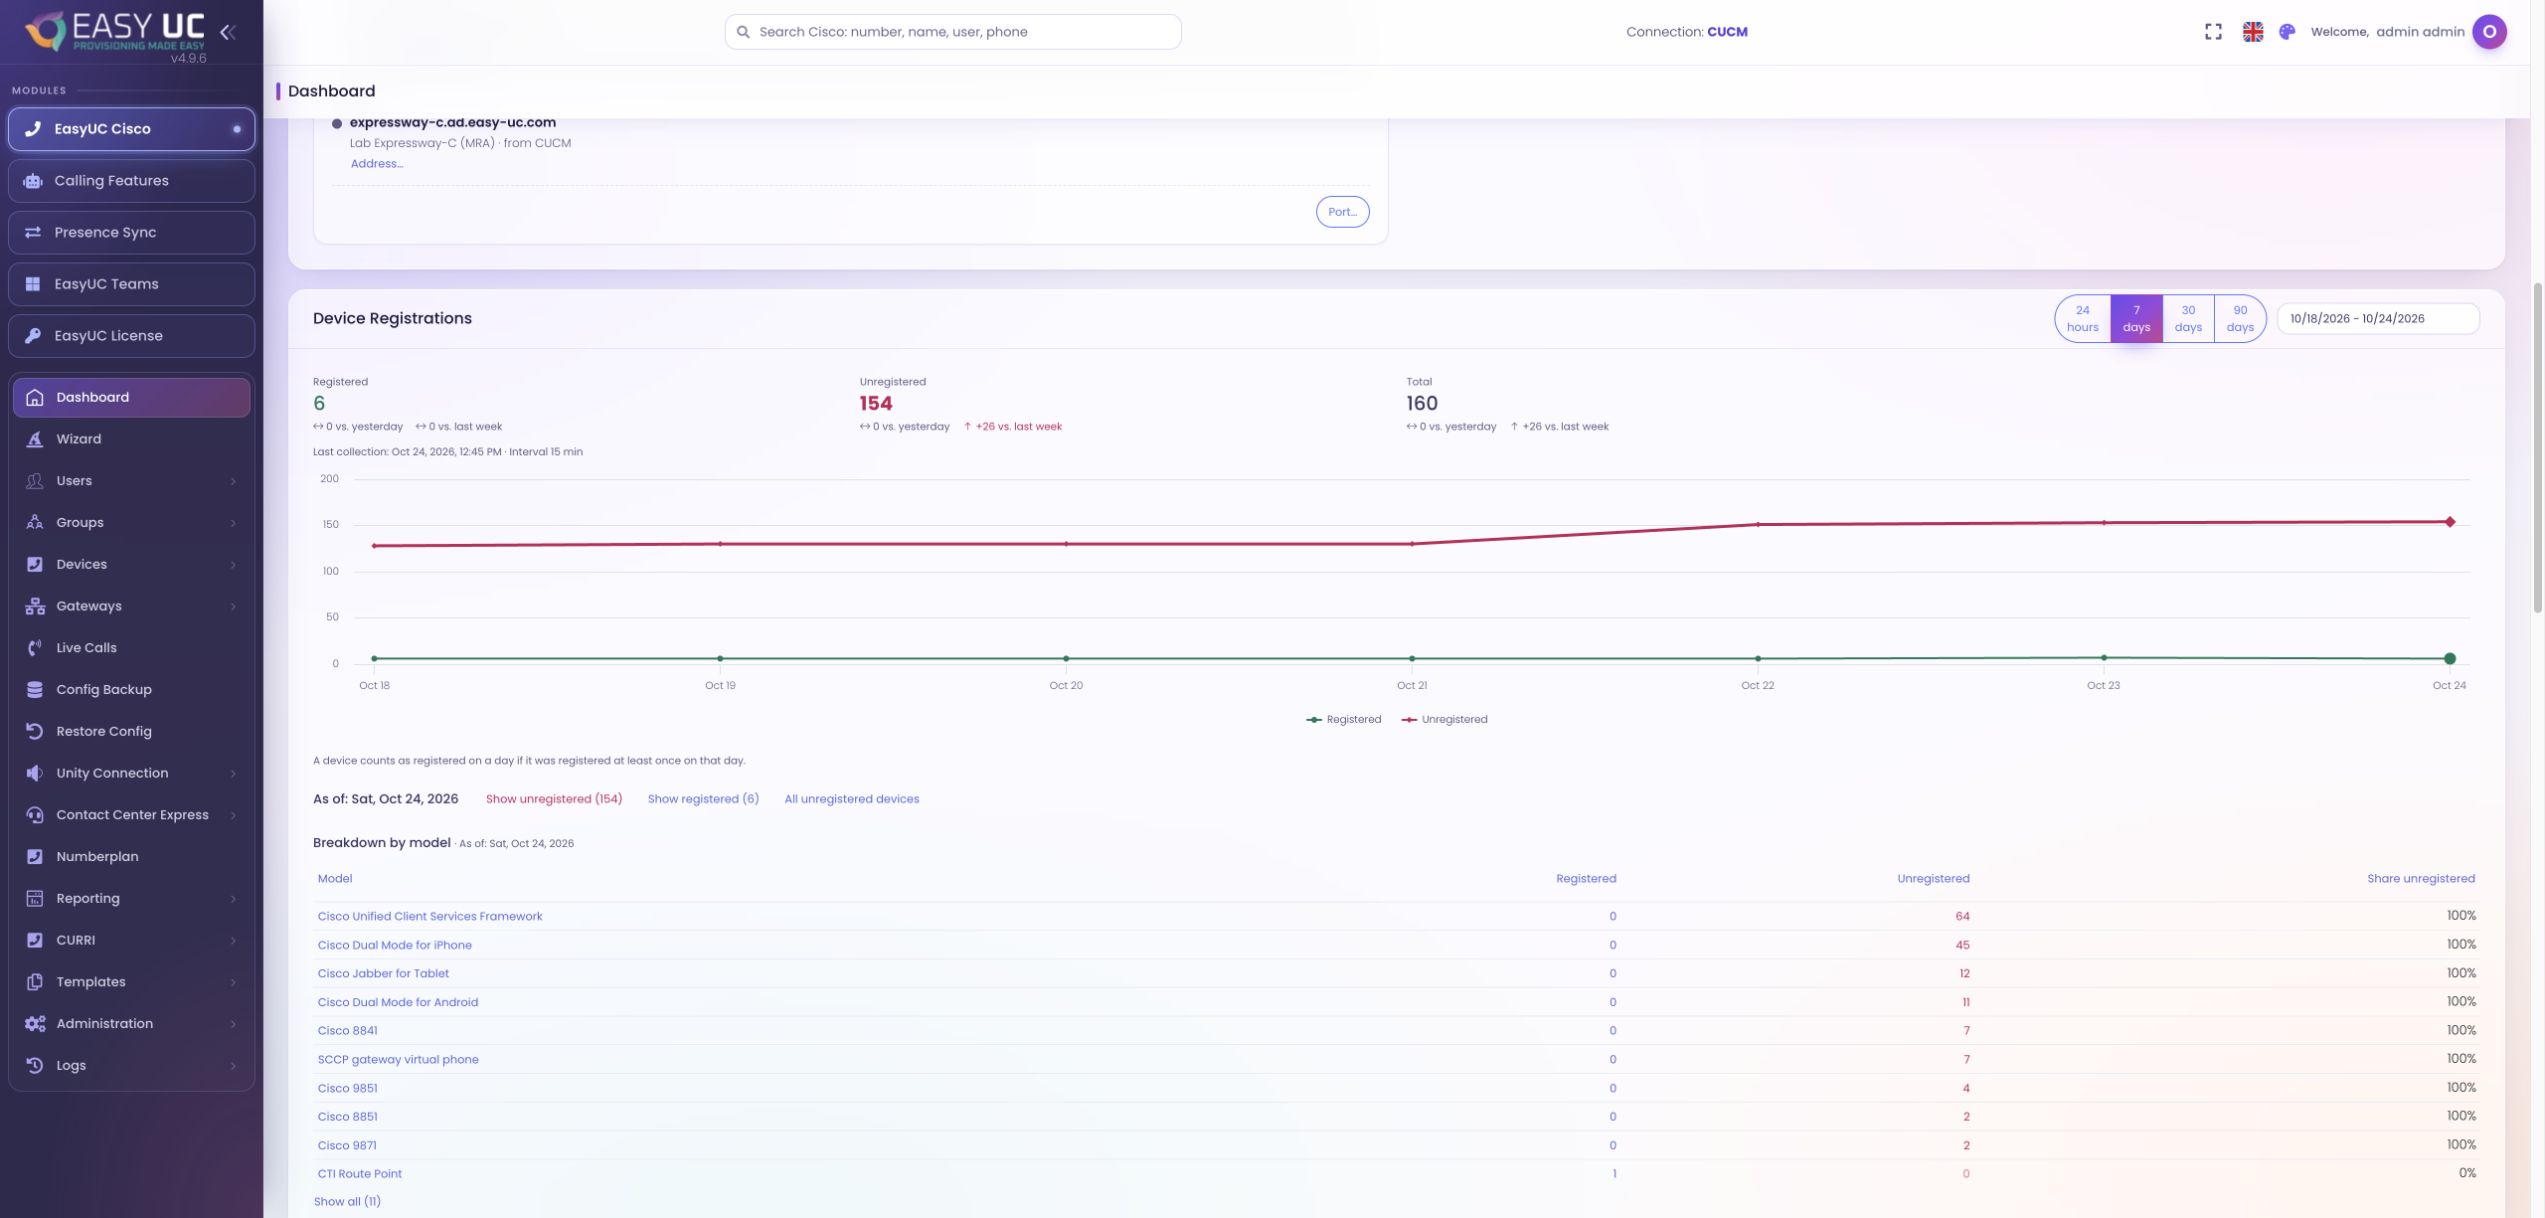
Check whether expected phones and clients are registered and whether the pattern matches a rollout or outage. Use registration history for timing, distinguish powered-off devices from unexpected loss and avoid treating registration as proof of voice quality.
Choose a useful change window
Where to work: Dashboard → Changes → Today / Yesterday / 7 days / 30 days
Choose today, yesterday, seven or thirty days to match the investigation. Review EasyUC, CUCM or combined changes together with source health, latest polling and coverage notices. A partial metric must not be read as a complete statistic.
Drill into the affected objects
Where to work: Change metric → Details dialog
Open a metric to inspect time, object, action, available actor and field changes. Note approximate timestamps or unknown actors. Use the evidence to investigate correlation with the reported issue without assuming that timing proves causation.
Choose the appropriate follow-up
Where to work: User actions / Logs / Device views
Continue in the user profile, device view or change log, or open User actions for recurring tasks. Record the checked cluster and period, confirmed issues and missing evidence to make the handover actionable.
The result
A cluster-specific overview with evidence for the next checks, linking metrics to objects and events while keeping incomplete coverage visible.
Good to know
- Dashboard sources update at different rates; source and coverage notices are part of interpreting each metric.
- Registrations and change counts do not establish call quality, every user’s reachability or SLA compliance.
Captures come from the EasyUC lab and demo environment. Captions identify setup and simulation states. If the interface is not yet available in your language, its original language is labelled. Available features depend on the version, permissions and configured connections.