
Call monitoring and SIP diagnostics
Call monitoring and SIP diagnostics
Inspect active calls, follow SIP signalling and export individual calls for Wireshark. EasyUC provides diagnostic tools for CUCM and the Teams SBC in one interface.
Running calls from CUCM and the SBC
The list of active calls comes from CUCM over JTAPI: who is talking to whom, on which device and for how long. Calls through the built-in SBC have their own list. You can also see when a caller is listening to an announcement on a CTI port.
SIP trace and call history per Teams tenant
Enable the SIP trace for a tenant and a defined period. EasyUC captures the SBC’s SIP messages through HEP and displays them as a list or ladder diagram. Capture stops when the period ends.
SRTP keys in the SDP are masked in the trace. Nobody reading it can use it to decrypt calls.
- Enabled per tenant
- Time-limited
- Captured via HEP
- SRTP keys masked
- Filter by Call-ID
What we do
The SBC reports every SIP message to EasyUC via HEP. For every Teams call EasyUC stores the flow between Microsoft and the SBC, without the periodic OPTIONS. For the whole tenant you can additionally switch on a SIP capture that ends by itself after 30 minutes.
What you get
A call history with search by number, Call-ID and period, kept per tenant between 1 and 365 days. Running calls update every 2 seconds. You download the flow as text and export the capture as pcap.
What it looks like
A ladder diagram with two lanes: Microsoft on the left, the EasyUC SBC on the right, and one arrow per message with the time in milliseconds between them. Messages with a media description carry the SDP badge. A click shows the complete message.
In the handbook: Teams calls, SIP flow and captures
pcap export for Wireshark
From the trace you export a pcap file, filtered to a single Call-ID if you like. Open it in Wireshark or TranslatorX.
This lets you provide the signalling for the affected call with a support request.
Example
$ ls -lh
-rw-r--r--  1 admin  48K  call-9d3f6b2e51c4.pcap

# Wireshark, display filter
sip.Call-ID == "9d3f6b2e51c44f0da7e13c8e0b7f2a14"

# show the call flow
Telephony › VoIP Calls › Flow Sequence
CUCM call diagnostics: the SIP call flow of one call from the traces
In CUCM there is no SBC that captures. EasyUC therefore takes the call flow from the trace files of CUCM.
What we do
You select the call in the call list or in the CURRI log. Through the log collection interface EasyUC loads the SDL traces of the Cisco CallManager service from all CallManager nodes of the cluster, picks out the SIP messages of exactly this call and puts them in time order. If the call went through a CUBE with debug capture switched on, EasyUC merges its messages in.
What you get
The call flow across all nodes and dialogs, without RTMT and without searching trace files. Exports as SIP text, as filtered log lines, as JSON and as SVG. Nothing is changed on CUCM and no trace is switched on. Credentials and SRTP keys are removed.
What it looks like
A call flow diagram with one lane per peer: phone, softphone, CUCM node, gateway or CUBE, trunk. Requests are blue, provisional responses grey, success green, redirections orange, errors red. Every dialog has its own colour and can be hidden. A click on an arrow opens the message.
In the handbook: Setting up and using call diagnosticsReading the SIP call flow diagramNarrowing down a call problem
| Time window | prefilled with 60 seconds before and after the call, adjustable from 1 second to 30 minutes |
|---|---|
| Start from the CURRI log | 60 seconds before the entry until 10 minutes after it |
| Nodes | all CallManager nodes of the cluster, at most 8 |
| Diagram | at most 800 messages per call |
| Concurrency | one diagnosis per CUCM connection, further ones wait |
| Age of the call | CUCM overwrites its traces; from two hours on EasyUC points this out |
| Setting on CUCM | trace level Detailed with Enable SIP Call Processing Trace for Cisco CallManager |
| Protocol | SIP; devices with SCCP and analogue ports do not appear in the diagram |
| Partial result | if a limit is reached, the result stays visible and gets the status "Partial" |
Call analysis: all calls of a period
Call diagnostics examines one known call. Call analysis answers the question before that: which calls were there in this period, and how did they end.
What we do
You select a CUCM connection and a period. EasyUC reads the CDR of the completed calls and the SIP messages from the traces of all CallManager nodes and merges both sources per call. The result is a stored run that you can open for 7 days without querying CUCM again.
What you get
Per call the result, the Q.850 and SIP cause in plain text, the redirect chain, the call flow, codec and RTP statistics and the devices involved. Calls that were never established and appear in no CDR are in the list as well. You export the list as CSV and a single call as JSON, SIP text or CDR.
What it looks like
A call list with start, caller, dialled and reached number, duration, result, devices, features and quality. You filter by result and feature and search for number, device, user or Call-ID. A call opens with overview, call flow, media and quality, devices and raw data.
In the handbook: Call analysis: pulling callsReading the call list, details and call flowUnderstanding cause codes
Questions it answers
- Why did the call at 10:42 not get through?
- Who hung up, and with which cause?
- Was the call redirected, and by whom?
- Which trunk and which node did it go through?
- Was there packet loss or jitter?
- Which calls failed between 10:00 and 10:30?
| CDR | list of completed calls with times, numbers, devices and causes; they appear only after the CDR interval of CUCM and the import |
|---|---|
| Traces | SIP messages and therefore the call flow, also for calls that were not established or are still running; SIP devices and SIP trunks only |
| Period with call flow | 60 seconds to 60 minutes |
| Period with CDR only | up to 24 hours, then without call flow |
| Retention | 7 days, at most 20 runs per connection |
| Quality values | jitter, packet loss and packet count from the SIP messages of the endpoints at the end of the call; MOS only if the endpoint reports it |
| Redirect chain | the CDR knows the first and the last redirection |
| Protective limits | 10,000 calls, 40,000 SIP messages and 15 minutes run time per run; if a limit is reached, the run ends as "Partial" with a note |
| Access | not for accounts restricted to locations; read-only accounts view and export stored runs |
Network capture with tcpdump
Some faults only show up below SIP: missing RTP packets, or a firewall that closes a connection after 30 seconds. For these, you start a tcpdump capture on the appliance directly from EasyUC.
A capture runs for 60 minutes or until it reaches 500 MB, whichever comes first. The result is a pcap file stored on the appliance.
tcpdump capture with filter and limits. Demo data.
Call recording for diagnostics
Record calls as stereo WAV files to investigate audio quality. The recording window can be set from 1 to 240 minutes.
Before a recording starts, the administrator has to confirm a notice on Section 201 of the German Criminal Code. Recording conversations without authorisation is a criminal offence, so agree with your data protection officer and works council beforehand when this feature may be used.
Recording starts only after the notice has been confirmed. Demo data.
Cisco CUCM diagnostics
CUCM logs, registration status and call details are available for Cisco telephony.
CUCM logs
EasyUC collects the CUCM log files in one place.
Registration status
Which phones, softphones and CTI ports are registered.
Call details
Reports from CUCM call detail records.
Call diagnostics
For a call from the call list, EasyUC loads the traces of the CallManager nodes and shows the SIP messages as a flow diagram.
Audit log
Who changed what and when, in EasyUC and directly in CUCM. Passwords and PINs are never stored.
Port monitor
Open ports, current connections and web sessions per node of the appliance.
Node details
Version, hardware, network and services of a CUCM node from the platform CLI.
Expressway status
Zones, calls, alarms and certificate expiry of Expressway-C and Expressway-E.
See the diagnostic tools in use
We will show you how to follow a call in a trace and export the data for analysis. Let us know whether you use CUCM, Microsoft Teams or both.
Existing customers
Licences, updates, invoices and support tickets are in the customer portal.
Go to the customer portalInside EasyUC
Monitoring and diagnostics in EasyUC
Actual views of the monitoring and troubleshooting tools.
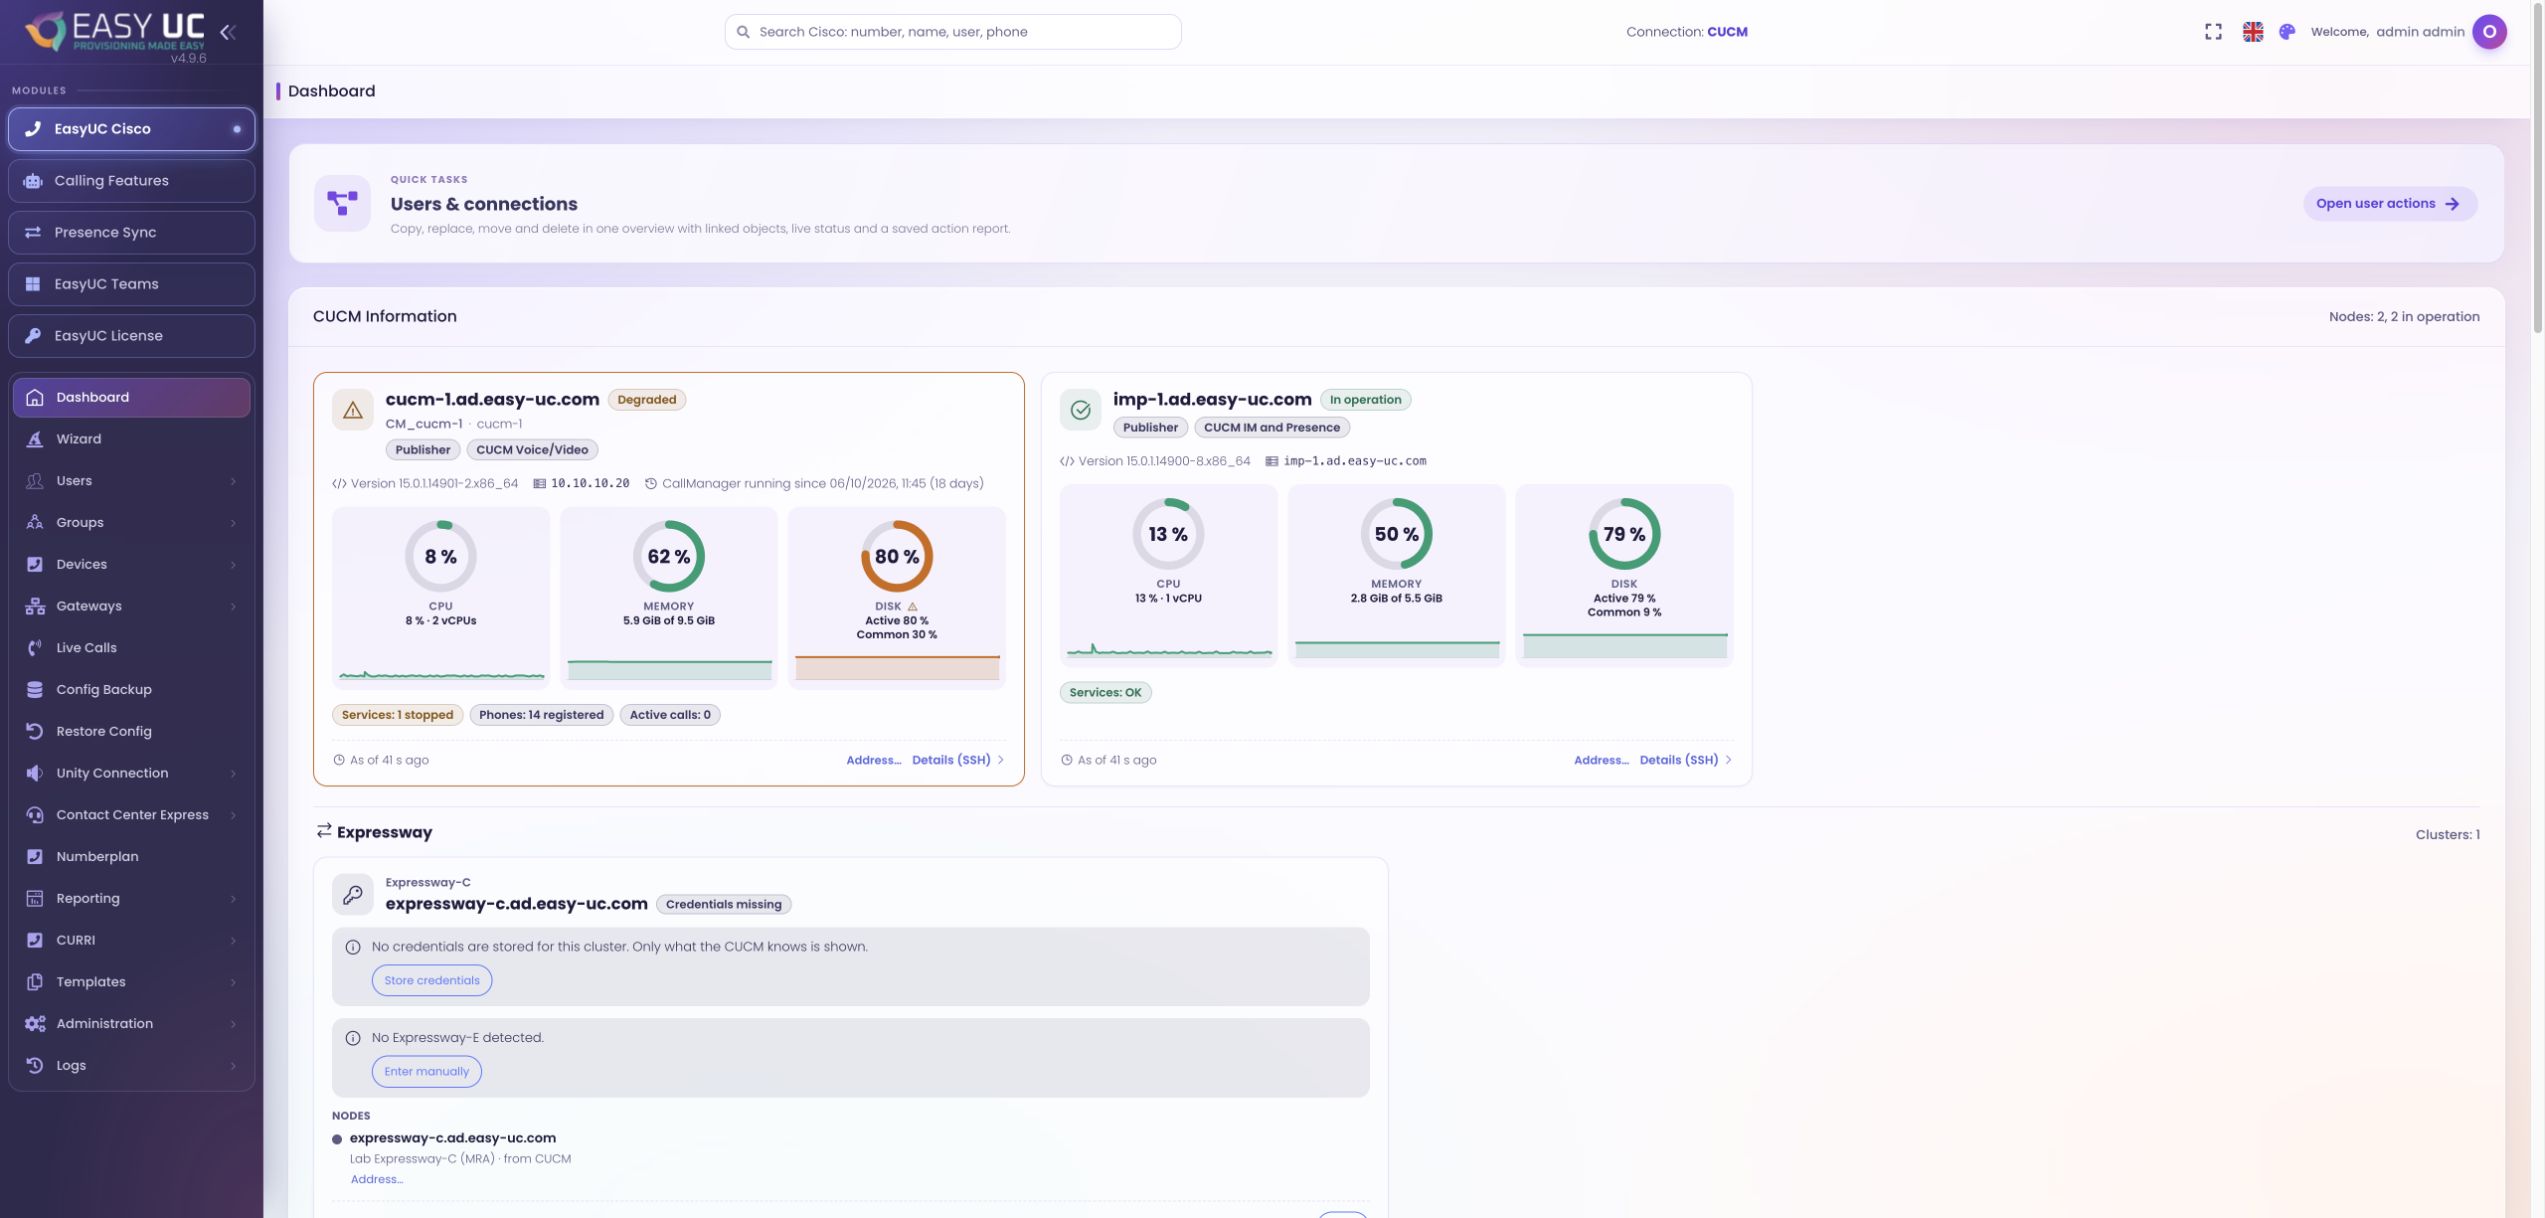
Monitor CUCM nodes
The dashboard shows lab-node health, including CPU, memory and disk usage and service status.
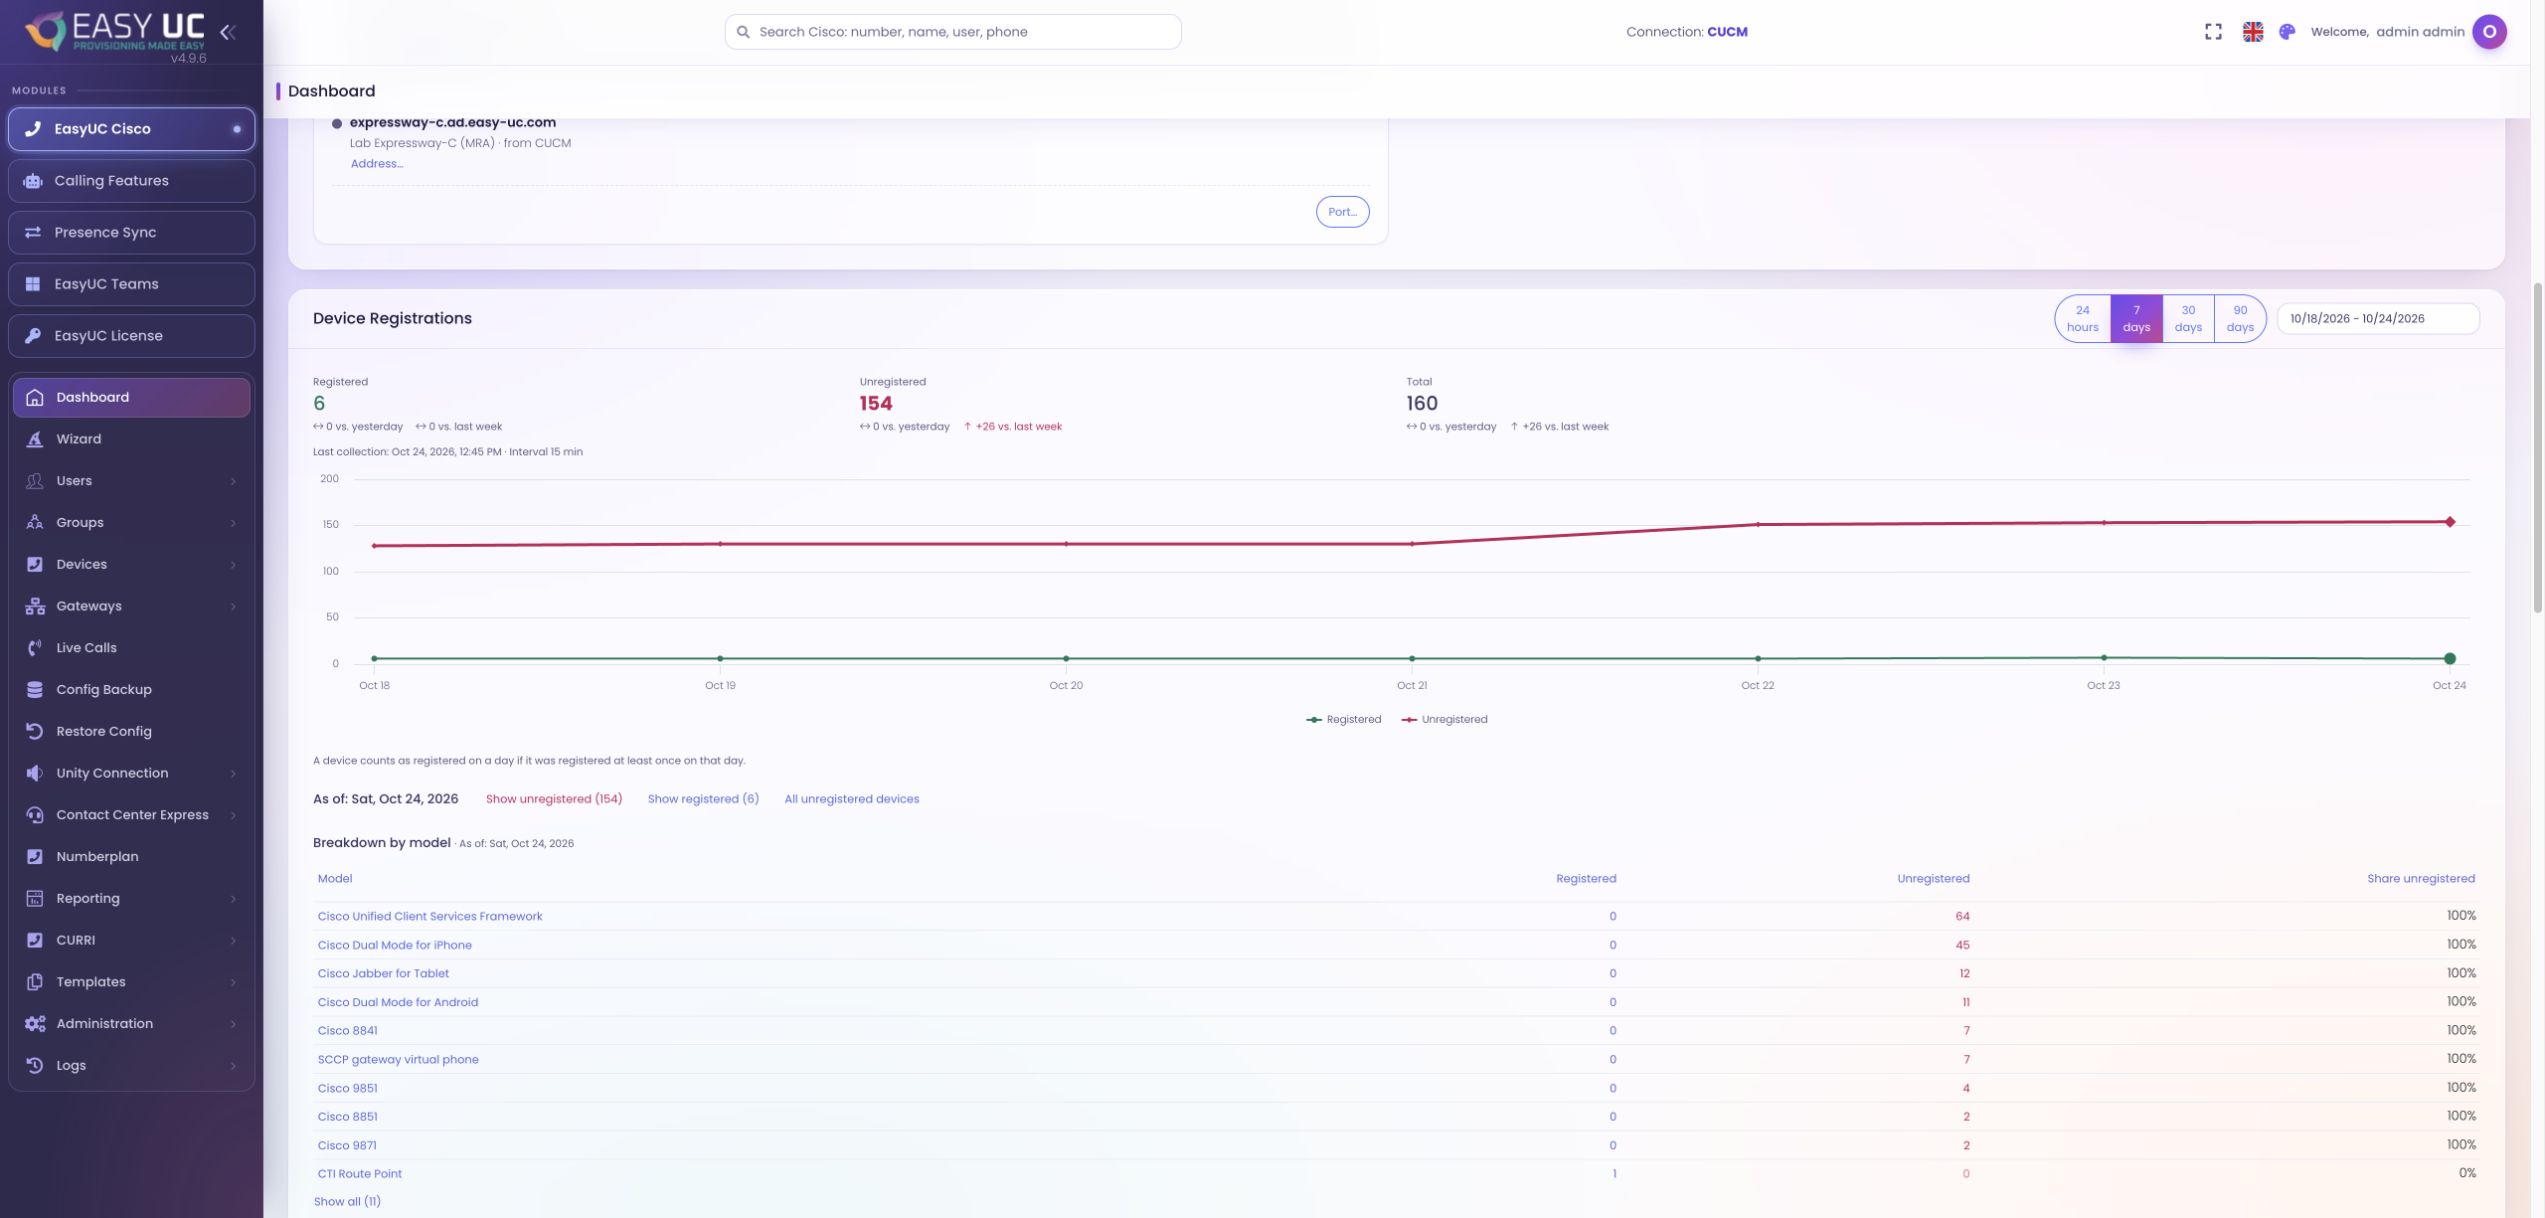
Phone registrations over time
Registered and unregistered phones over seven days, with a breakdown by phone model.
These captures show the actual EasyUC interface in a lab/demo environment. Open an image to see it in more detail. Parts of the lab interface are not yet fully translated. When a matching language version is unavailable, the different screenshot language is labelled.
Features in practice
Understand the state of your telephony
Resource indicators and registration history help you assess the current state and investigate changes.
CUCM nodes and resources at a glance Identify nodes that need attention and review resource usage and services in one place.
The dashboard presents CUCM and IM and Presence as individual node cards. Each node’s name, role, address, version and state provide context when investigating an issue. Version differences and outdated measurements are flagged on the relevant card.
CPU, memory and disk usage are shown with utilisation indicators and a 60-minute history. Available service, replication, phone and call information adds context. For a closer inspection, the node detail view provides version data, hardware, network configuration and service status.
How to use this feature
- Review nodes in the dashboard
Open the dashboard and locate the node you want to investigate in the CUCM overview. Its name, role and address help you identify it.
- Read usage and history
Compare CPU, memory and disk indicators with the small history charts. The displayed collection time shows how recent the measurements are.
- Review operational status
Check the available replication and service information, along with phone and call counts. Notices on the card identify missing or outdated data.
- Open node details
With the required permission, open the SSH details. Review and refresh the active and inactive versions, hardware, IP and DNS configuration, and the list of services.
Review phone registrations over time and by model Move from the overview of registered and unregistered phones to specific models and devices.
The registration tile shows registered, unregistered and total devices from the last complete collection. Its timestamp, collection interval and available comparison figures put the numbers in context. Unknown states, overdue collections and incomplete runs are identified.
Choose a period such as seven days or set your own date range. A device counts as registered within a daily or hourly interval if it was registered at least once during that interval. The model breakdown and device lists let you investigate the selected figures further.
How to use this feature
- Choose a period
Open phone registrations in the dashboard and select seven days, for example. Other preset periods and a custom date range are also available.
- Compare figures and history
Review the figures from the last complete run and select a point on the chart. The view shows the registered and unregistered devices for that interval.
- Narrow down by phone model
The table breaks down the figures by model and shows the share of unregistered devices. Sort the columns or click a model to filter the history.
- View the devices
With permission to view registration data, open the relevant device list. It includes the name, model, last status, last-seen time, IP address and directory number.
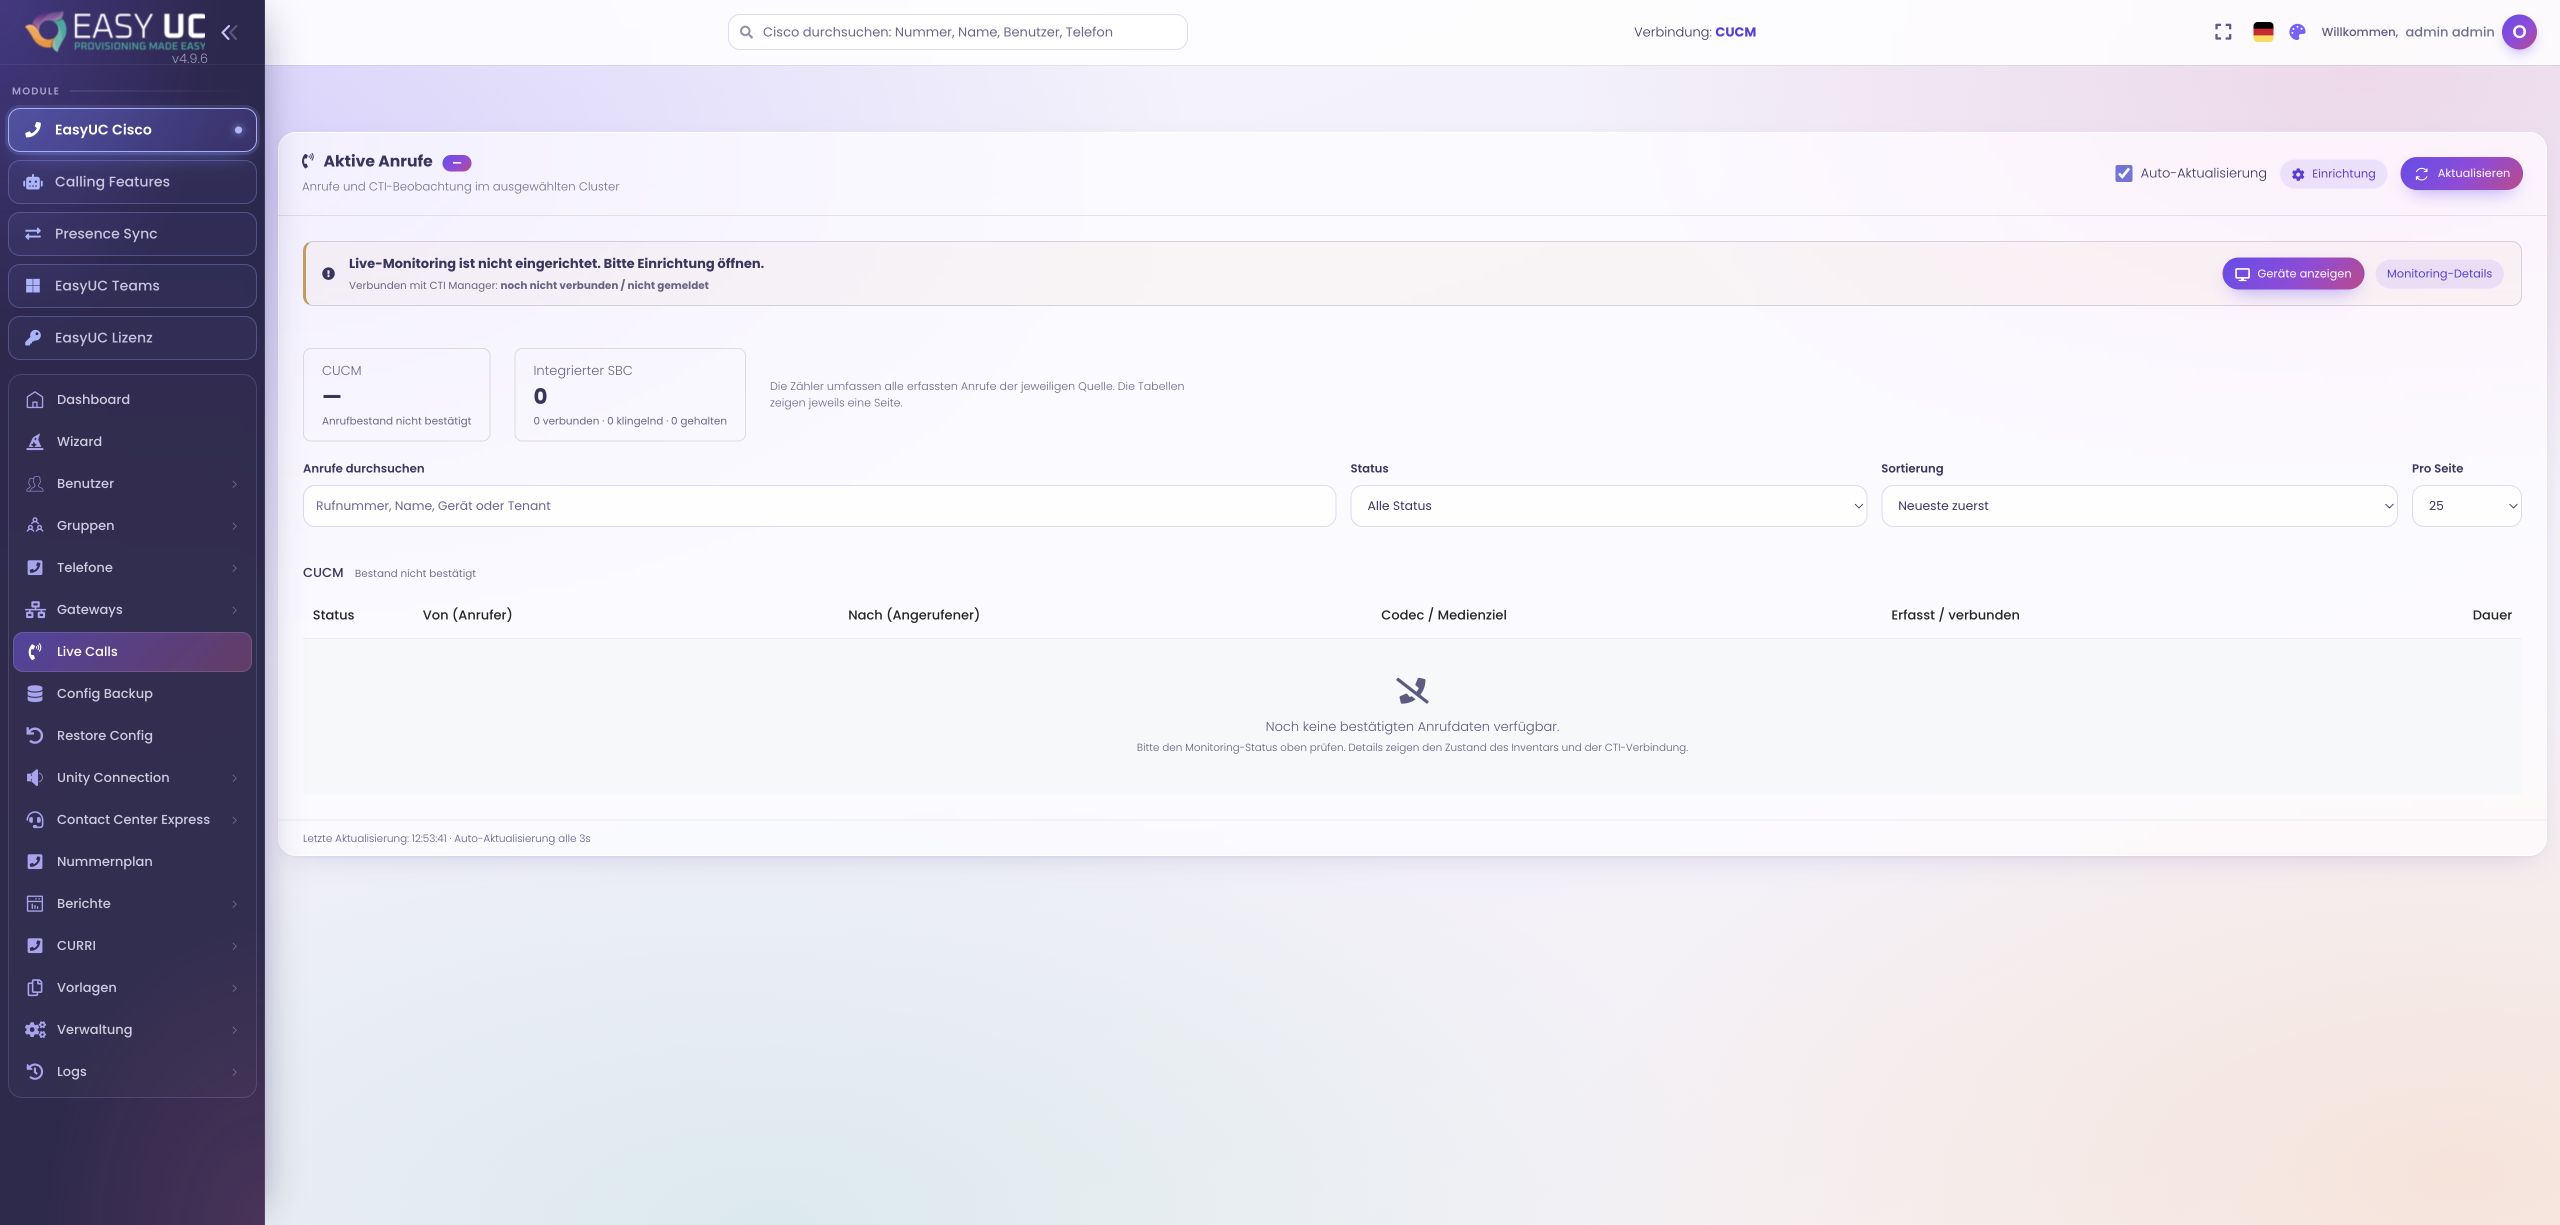
Set up and filter live calls Configure CUCM monitoring and use search and filters for the available CUCM and SBC calls.
For CUCM, EasyUC uses a dedicated CTI application user to observe calls. In setup, enter the credentials, choose the monitoring scope and enable the function. Calls through the integrated SBC come from a separate source. The screenshot shows the lab setup view: CUCM monitoring has not yet been configured there, and no active calls are shown.
The view provides call search, source and status filters, and sorting by newest, oldest or longest calls, or ringing calls first. States such as call setup, ringing, connected and, for SBC calls, on hold provide context. Page size, automatic refresh and monitoring details complete the overview.
How to use this feature
- Check the call source
Open live calls and check the available source. For CUCM, open setup; calls through the integrated SBC are provided through its integration.
- Enable CUCM monitoring
Enter the CTI application user and password, set the device scope and choose “Save & apply”. Review the setup result; the devices to be monitored must be accessible to that user.
- Filter and sort calls
Search for the call you need and filter by source or status. Choose the sort order and a page size of 25, 50 or 100 entries.
- Use refresh and monitoring details
Enable automatic refresh as needed or refresh manually. Open monitoring details when you want to check the state of monitoring.
How does this become a working process? Our use cases show each step directly in the EasyUC interface.
Explore practical examples